|
|
|
|
|
|
|
|
|
|
|
|
| Numbers and Sets |

About Algebra
Addition and Subtraction Multiplication and Division Criterions for Divisibility
Geometric Interpretation of Real Numbers Irrational Number Properties of Real Numbers Proportions Property of Equal Proportions Graphical Illustrations
Subsets Operations with Sets Intervals |
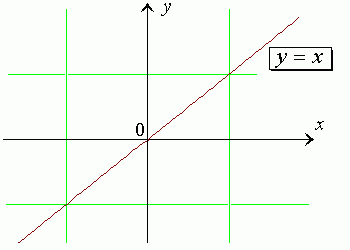
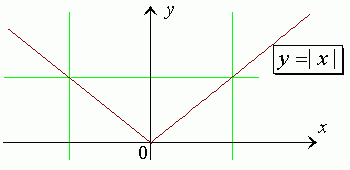
In the figures below, there are shown graphs of the functions y = ± x and y = | x |.
(Put the pointer anywhere around the above figure to to get a graph of the
function y = –x.
)
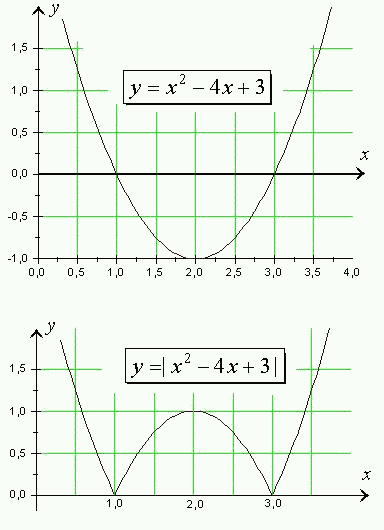
Compaire also the other pair of graphs, y
= x2 – 4 x
+ 3 and y
= | x2 – 4 x
+ 3 |:
|